서론
R에 기본적으로 내장된 Indometh (Indomethacin IV bolus 시의 PK) 의 concentration-time curve를 ggplot2와 Hmisc 패키지를 사용해 각각 그려보겠습니다.
먼저 ggplot2를 사용해 그림을 그려보면 다음과 같습니다.
library(ggplot2)
head(Indometh)
## Subject time conc
## 1 1 0.25 1.50
## 2 1 0.50 0.94
## 3 1 0.75 0.78
## 4 1 1.00 0.48
## 5 1 1.25 0.37
## 6 1 2.00 0.19ggplot(Indometh, aes(x=time, y=conc, col = Subject)) +
geom_line() +
geom_point()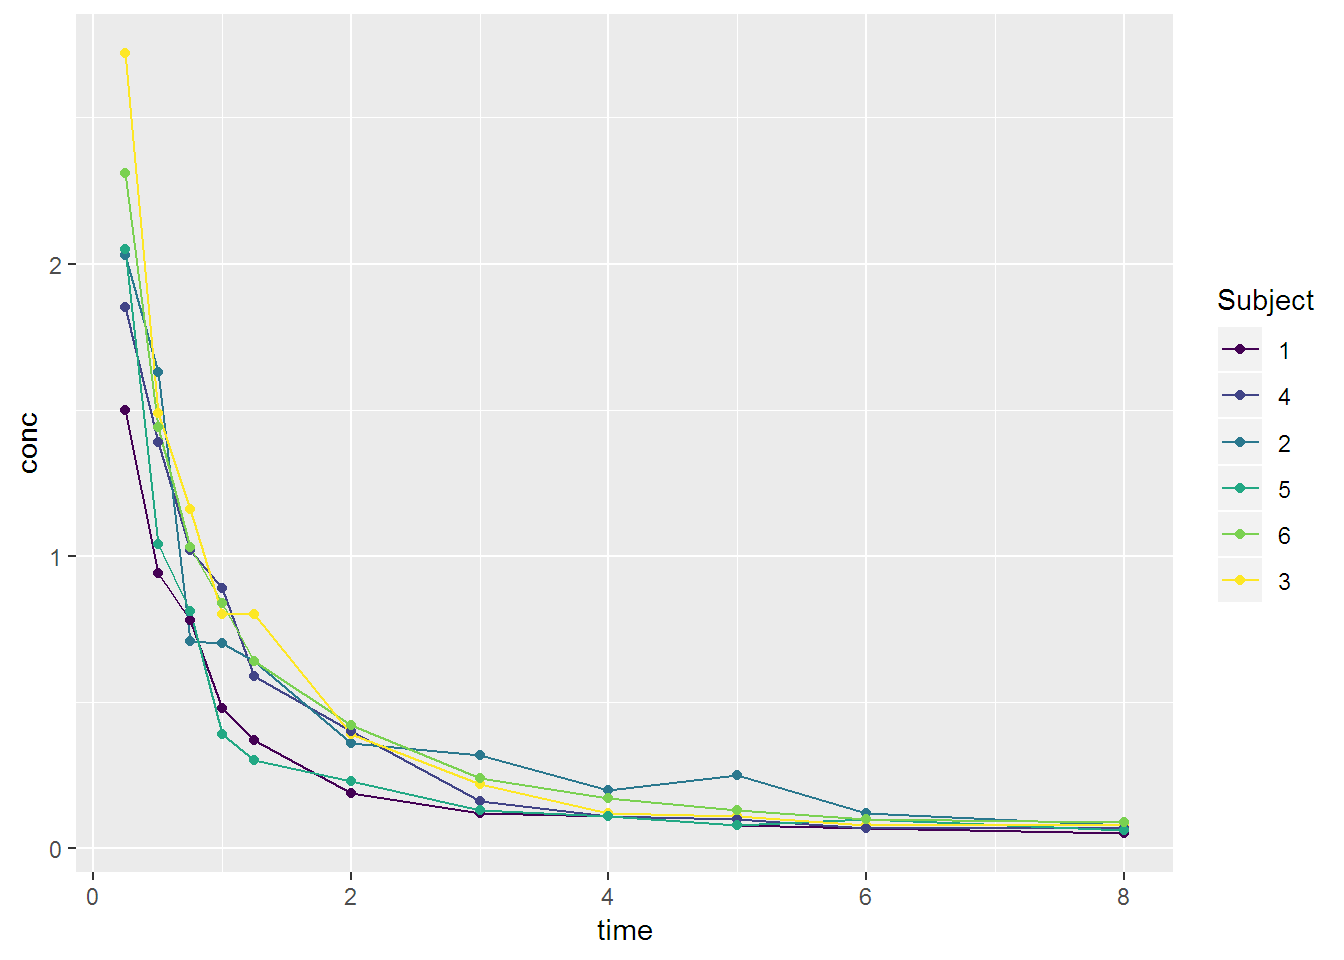
ggplot2를 사용하여 errorbar 그리기
stat_summary함수를 사용하여 손쉽게 계산할 수 있습니다.
ggplot(Indometh, aes(x=time, y=conc)) +
  stat_summary(fun.y=mean, geom=c("line"), size=0.3) +
  stat_summary(fun.y=mean, geom=c("point"), size=2) +
  stat_summary(fun.data = "mean_cl_boot", geom = "errorbar", col = "red", width = 0.3)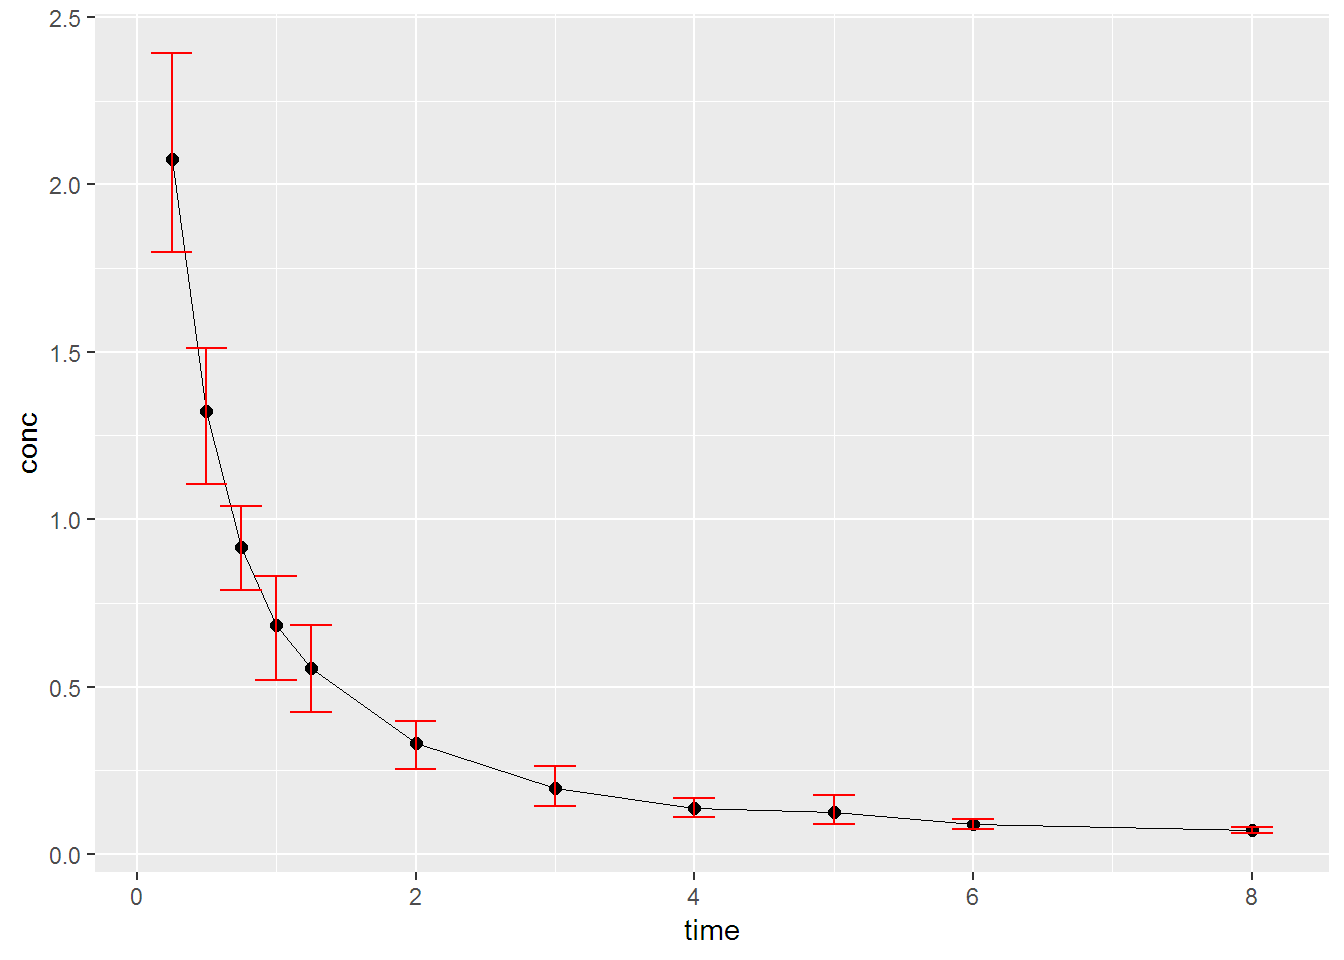
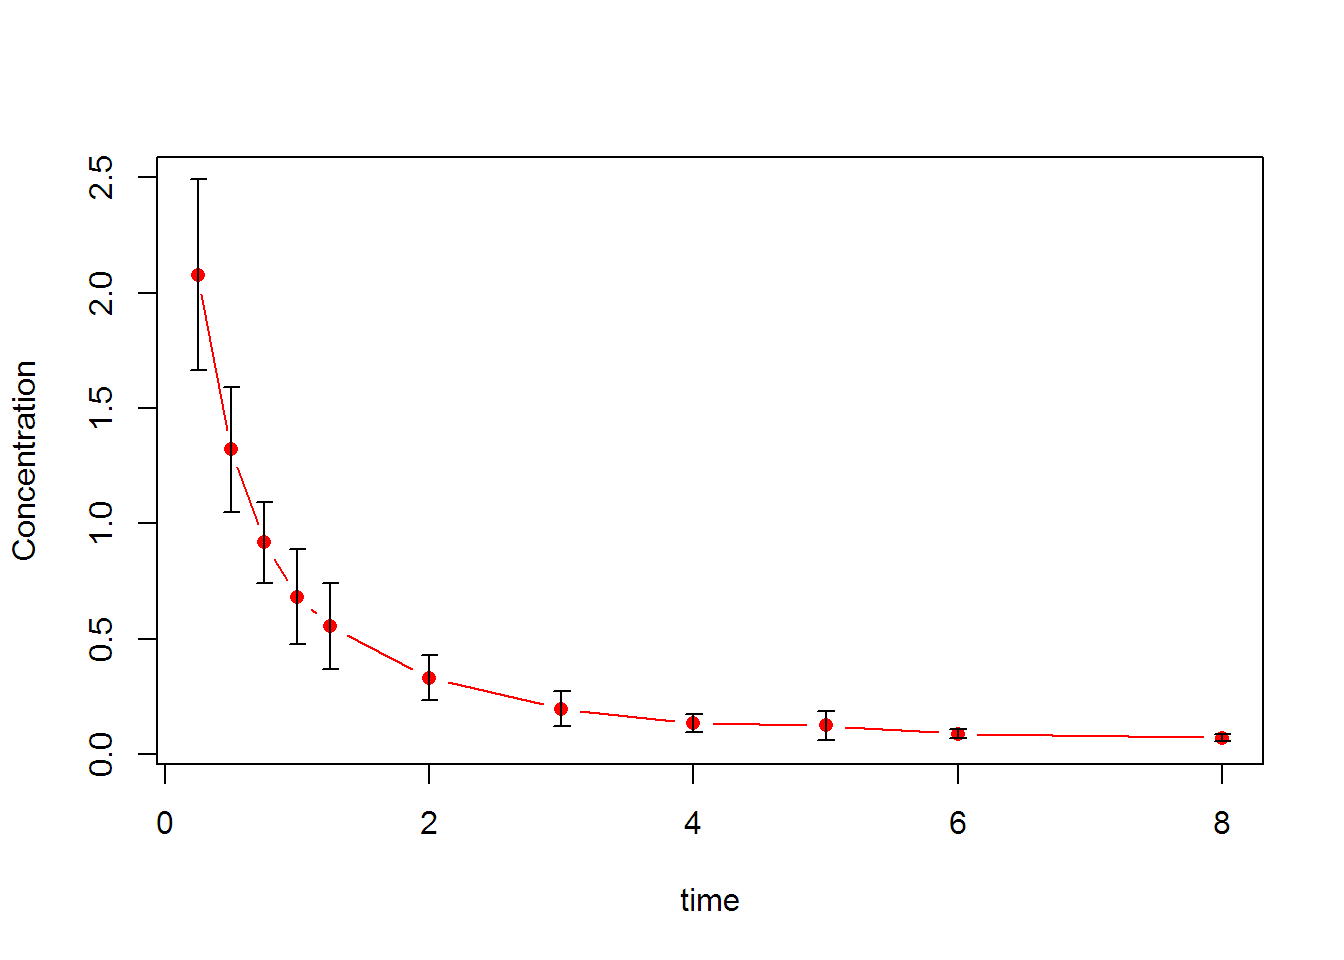
Hmisc::errbar 함수를 사용하여 error bar 그리기
- 평균과 표준편차를 미리 계산해야 한다는 점에서 ggplot을 사용한 것보다 단점이 있습니다.
- Axis 4를 사용한 Y축이 두개인 그래프를 그릴때 활용할 수 있습니다.
library(dplyr)

# Data Prep for Mean and SD
Indometh2 <- Indometh %>%
  group_by(time) %>%
  summarise(Concentration = mean(conc), StandardDev = sd(conc))
Indometh2
## # A tibble: 11 x 3
## time Concentration StandardDev
## <dbl> <dbl> <dbl>
## 1 0.25 2.08 0.414
## 2 0.5 1.32 0.271
## 3 0.75 0.918 0.176
## 4 1 0.683 0.204
## 5 1.25 0.557 0.187
## 6 2 0.332 0.0970
## 7 3 0.198 0.0765
## 8 4 0.137 0.0388
## 9 5 0.125 0.0641
## 10 6 0.09 0.0200
## 11 8 0.0717 0.0147# Drawing
with(Indometh2,
Hmisc::errbar(x = time,
y = Concentration,
yplus = Concentration+StandardDev,
yminus = Concentration-StandardDev,
col ="red", type = "b"))