Introduction and Methods
The number of publications containing NONMEM was retrieved from the Pubmed search at 2017-04-27 07:30 KST by Download CSV functionality and the CSV file was processed by R 3.4.0 (R Core Team 2017) and ggplot2 (Wickham and Chang 2016).
Pubmed search
Results
Plot
Results from a PubMed search for the term, NONMEM were plotted against the year the publication appeared.
library(knitr)
library(ggplot2)
library(dplyr)
timeline <- read.csv("data-raw/timeline.csv", skip = 1, stringsAsFactors = FALSE) %>%
mutate(percentage = round(count/sum(count)*100, 2)) %>%
arrange(year) %>%
mutate(cum_percent = cumsum(percentage))
ggplot(data=timeline, aes(x=year, y=count)) +
geom_bar(stat="identity") + guides(fill=FALSE) +
xlab("Year") + ylab("Number of Articles") +
ggtitle("Increase of Articles Using NONMEM")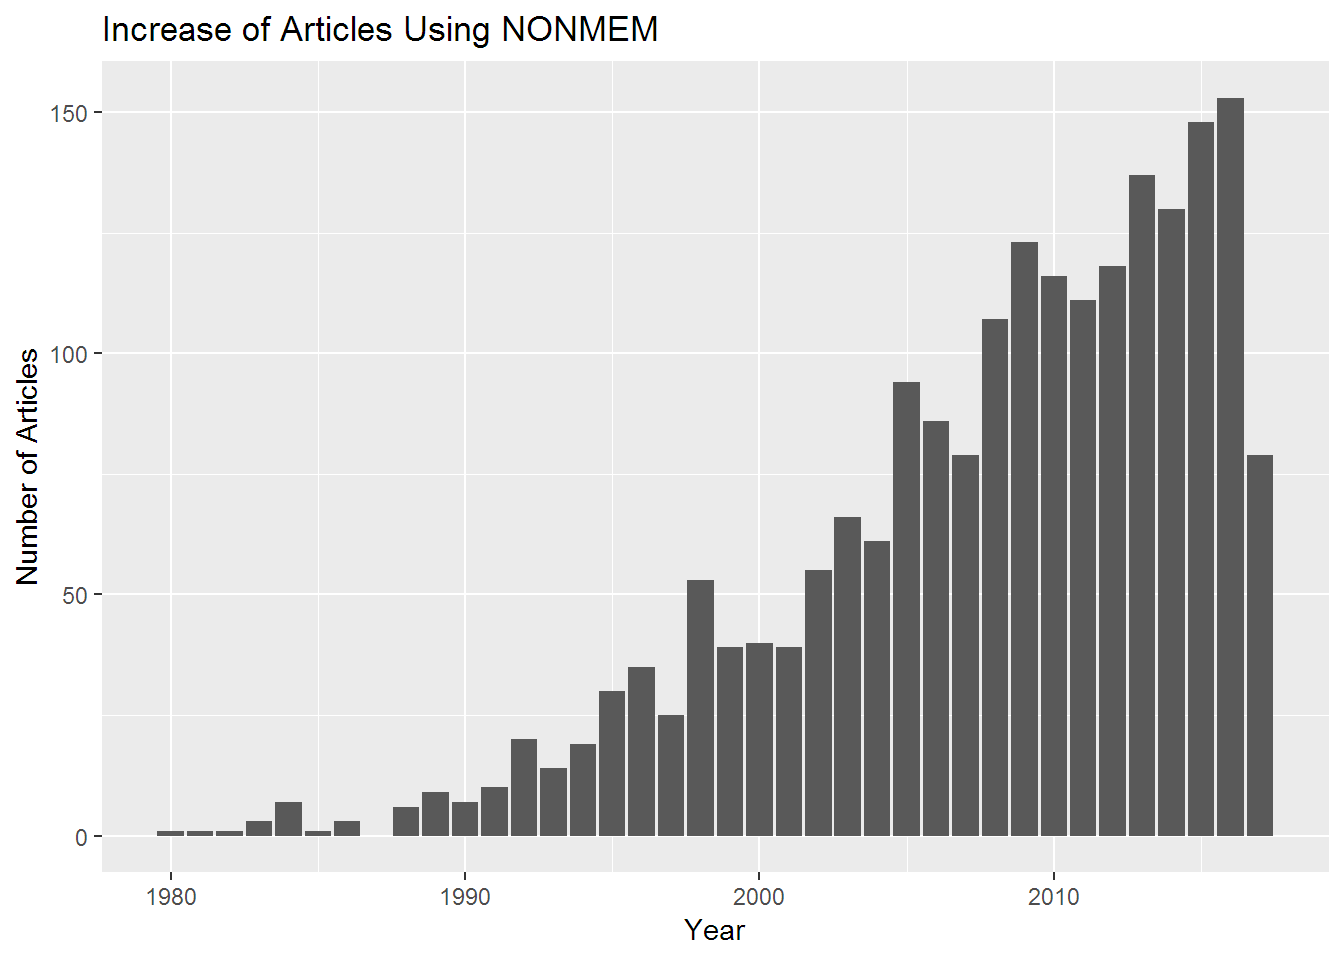
Figure 1: Publications utilizing NONMEM
(Information Retrieved from Pubmed Search at 2017-04-27 07:30 KST)
Raw data
Results from a PubMed search for the term, NONMEM were listed.
knitr::kable(timeline, caption = "Raw data of the number of publications utilizing NONMEM.")| year | count | percentage | cum_percent |
|---|---|---|---|
| 1980 | 1 | 0.05 | 0.05 |
| 1981 | 1 | 0.05 | 0.10 |
| 1982 | 1 | 0.05 | 0.15 |
| 1983 | 3 | 0.15 | 0.30 |
| 1984 | 7 | 0.35 | 0.65 |
| 1985 | 1 | 0.05 | 0.70 |
| 1986 | 3 | 0.15 | 0.85 |
| 1988 | 6 | 0.30 | 1.15 |
| 1989 | 9 | 0.44 | 1.59 |
| 1990 | 7 | 0.35 | 1.94 |
| 1991 | 10 | 0.49 | 2.43 |
| 1992 | 20 | 0.99 | 3.42 |
| 1993 | 14 | 0.69 | 4.11 |
| 1994 | 19 | 0.94 | 5.05 |
| 1995 | 30 | 1.48 | 6.53 |
| 1996 | 35 | 1.73 | 8.26 |
| 1997 | 25 | 1.23 | 9.49 |
| 1998 | 53 | 2.62 | 12.11 |
| 1999 | 39 | 1.92 | 14.03 |
| 2000 | 40 | 1.97 | 16.00 |
| 2001 | 39 | 1.92 | 17.92 |
| 2002 | 55 | 2.71 | 20.63 |
| 2003 | 66 | 3.26 | 23.89 |
| 2004 | 61 | 3.01 | 26.90 |
| 2005 | 94 | 4.64 | 31.54 |
| 2006 | 86 | 4.24 | 35.78 |
| 2007 | 79 | 3.90 | 39.68 |
| 2008 | 107 | 5.28 | 44.96 |
| 2009 | 123 | 6.07 | 51.03 |
| 2010 | 116 | 5.73 | 56.76 |
| 2011 | 111 | 5.48 | 62.24 |
| 2012 | 118 | 5.82 | 68.06 |
| 2013 | 137 | 6.76 | 74.82 |
| 2014 | 130 | 6.42 | 81.24 |
| 2015 | 148 | 7.31 | 88.55 |
| 2016 | 153 | 7.55 | 96.10 |
| 2017 | 79 | 3.90 | 100.00 |
Conclusion
The number of publications utilizing NONMEM tends to increase.
References
R Core Team. 2017. R: A Language and Environment for Statistical Computing. Vienna, Austria: R Foundation for Statistical Computing. https://www.R-project.org/.
Wickham, Hadley, and Winston Chang. 2016. Ggplot2: Create Elegant Data Visualisations Using the Grammar of Graphics. https://CRAN.R-project.org/package=ggplot2.