Correlation plot을 그리는 R 코드입니다.
panel.cor()는 correlation coefficient를 구하는 함수입니다.
ETA와 covariate와의 관계를 나타낼 때도 쓰일 수 있습니다.
library(dplyr)
library(tibble)

# calculation of cor
panel.cor <- function(x, y, digits=2, prefix="", cex.cor) {
  usr <- par("usr"); on.exit(par(usr))
  par(usr = c(0, 1, 0, 1))
  r = (cor(x, y))
  txt <- format(c(r, 0.123456789), digits=digits)[1]
  txt <- paste(prefix, txt, sep="")
  if(missing(cex.cor)) cex <- 1.5
  text(0.5, 0.5, txt, cex = 1.5)
}

# Theoph dataset
Theoph_nca <- NonCompart::tblNCA(Theoph, key=c("Subject", "Wt"), dose=320, concUnit="mg/L") %>%
  as.tibble() %>%
  mutate_all(funs(as.numeric)) %>%
  select(Wt, CMAX, TMAX, AUCLST)

# Pair plot
pairs(Theoph_nca,
      lower.panel=panel.smooth,
upper.panel=panel.cor) 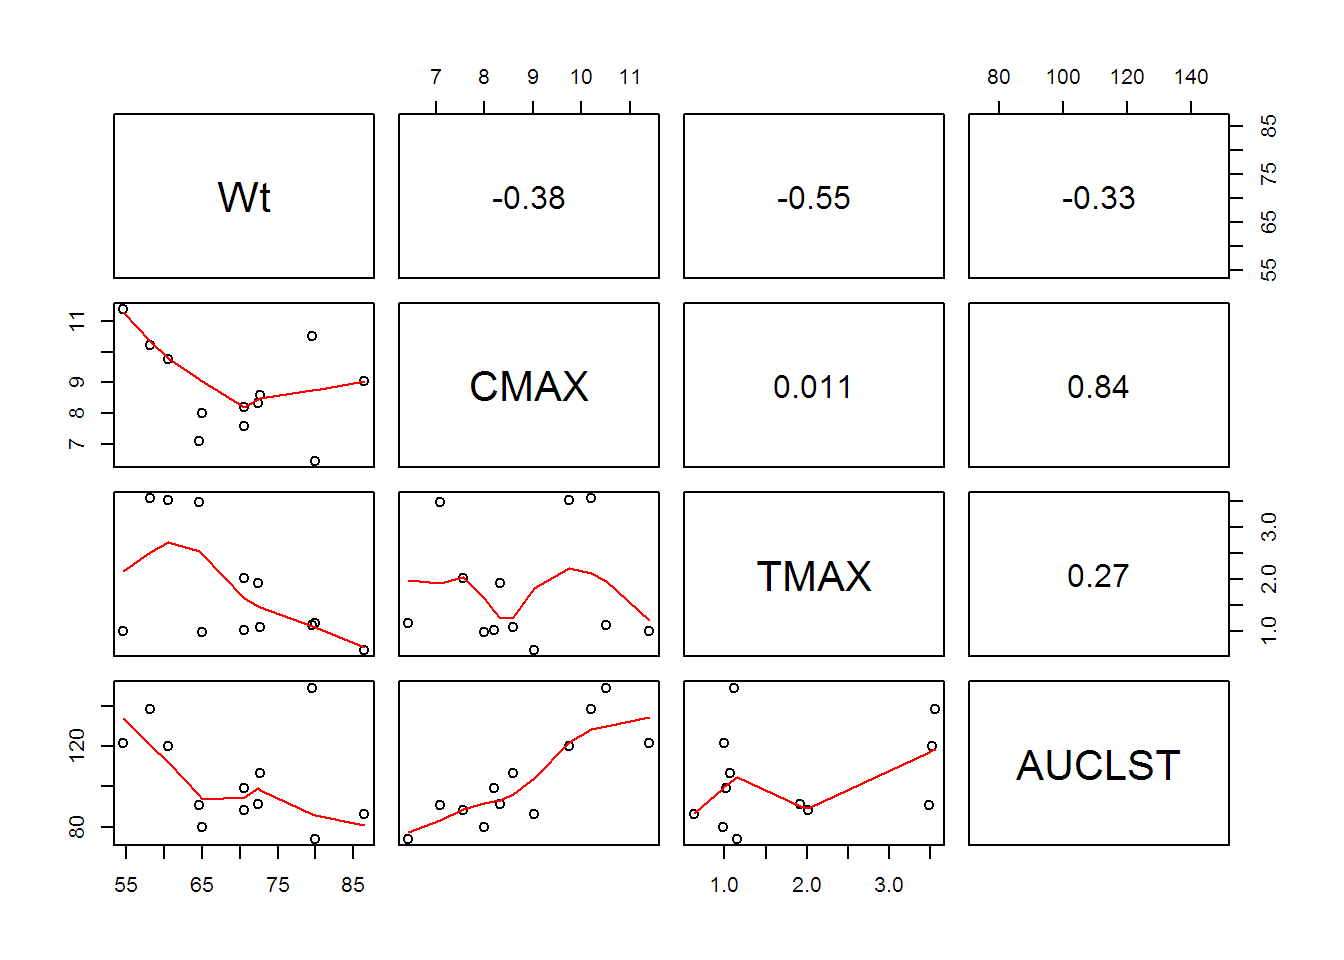
psych 패키지를 사용해서 그릴 수도 있습니다.
library(psych)
pairs.panels(attitude)   #see the graphics window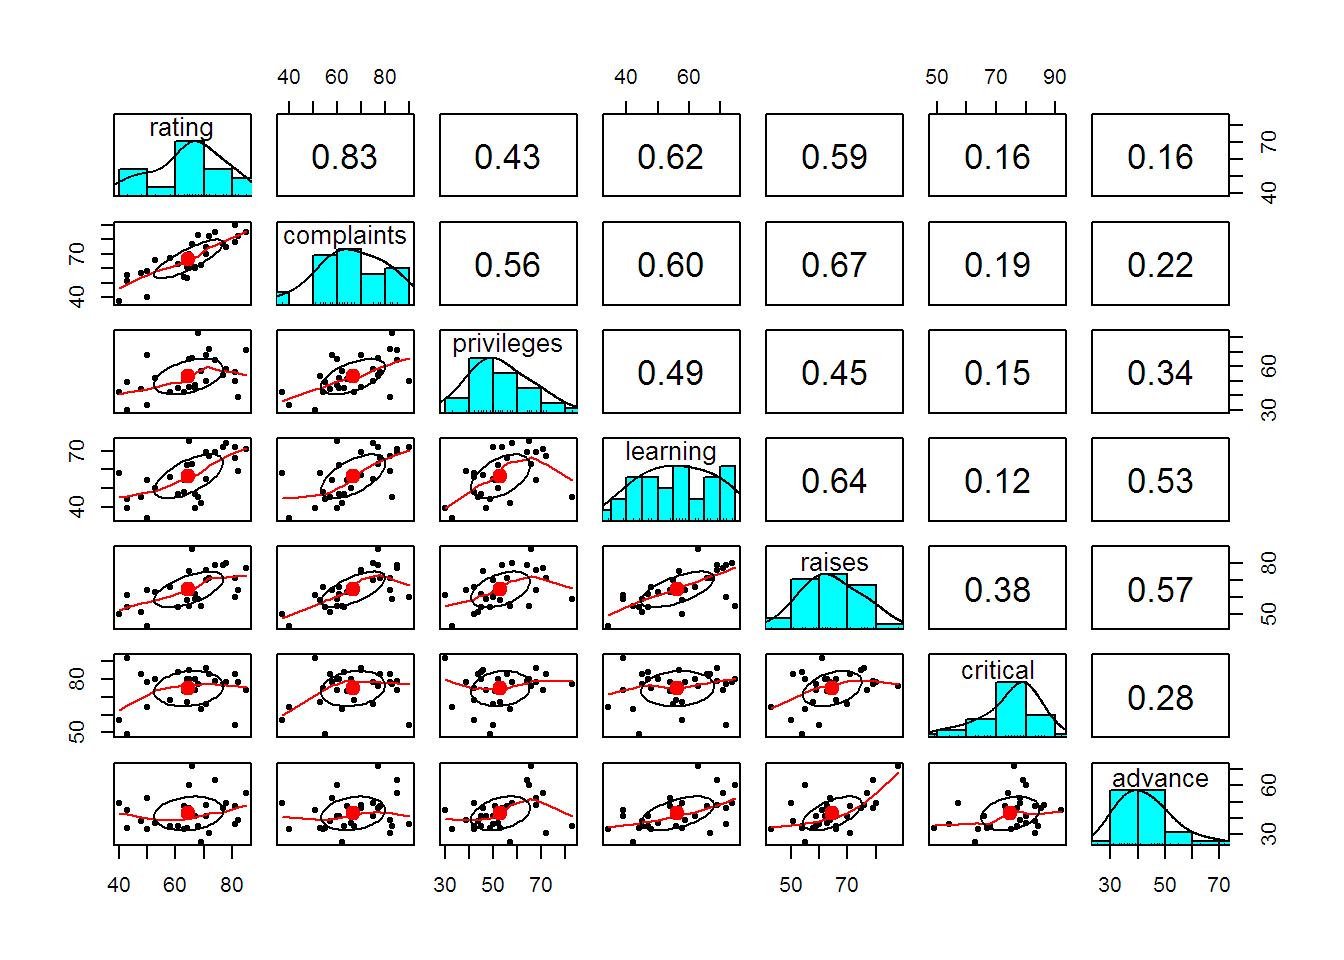
data(iris)
pairs.panels(iris[1:4],bg=c("red","yellow","blue")[iris$Species],
        pch=21,main="Fisher Iris data by Species") #to show color grouping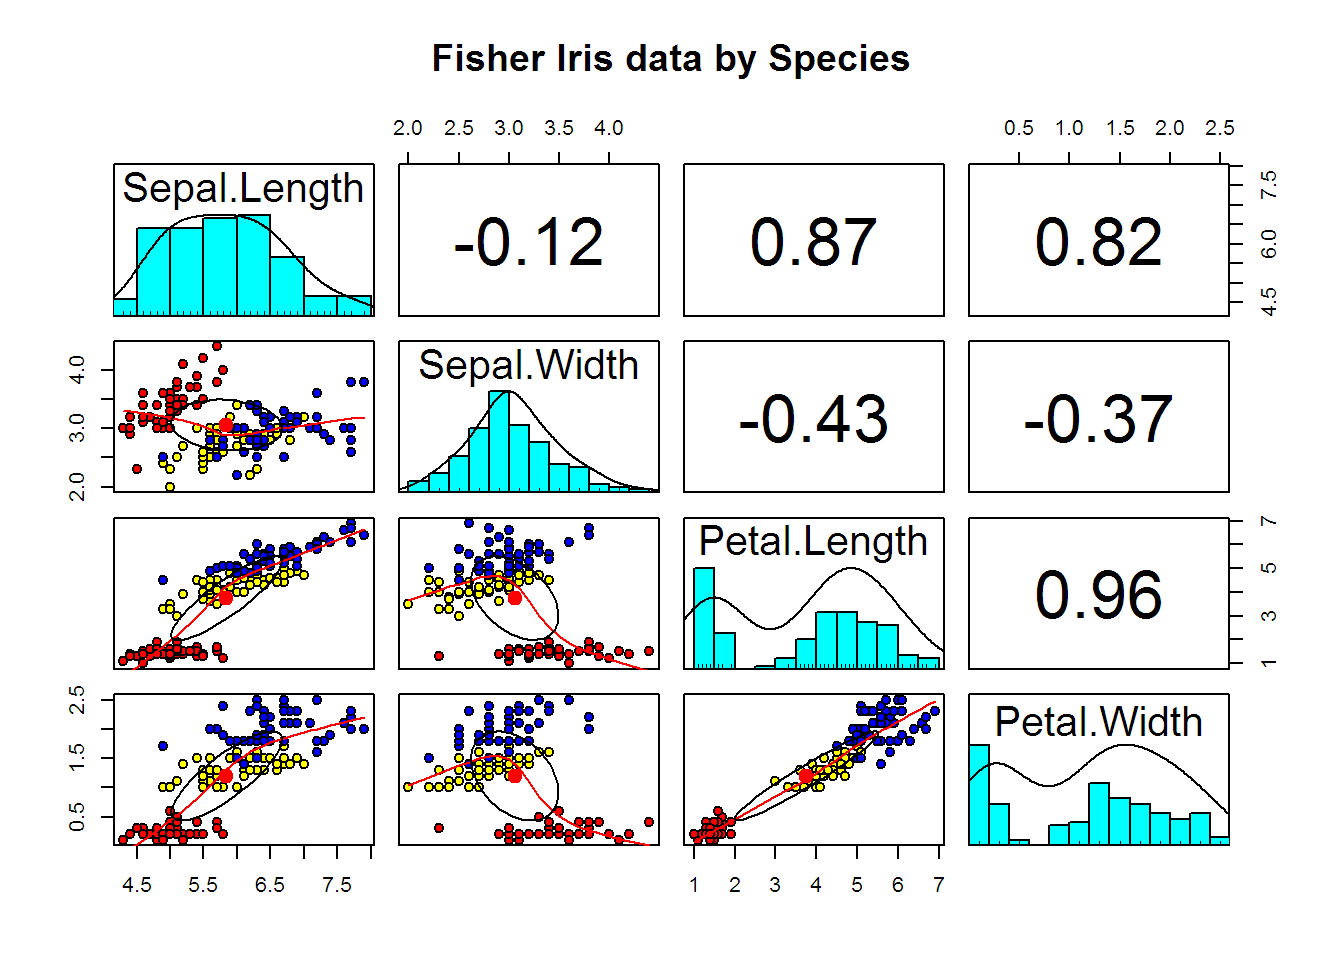
pairs.panels(iris[1:4],bg=c("red","yellow","blue")[iris$Species],
pch=21+as.numeric(iris$Species),main="Fisher Iris data by Species",hist.col="red") 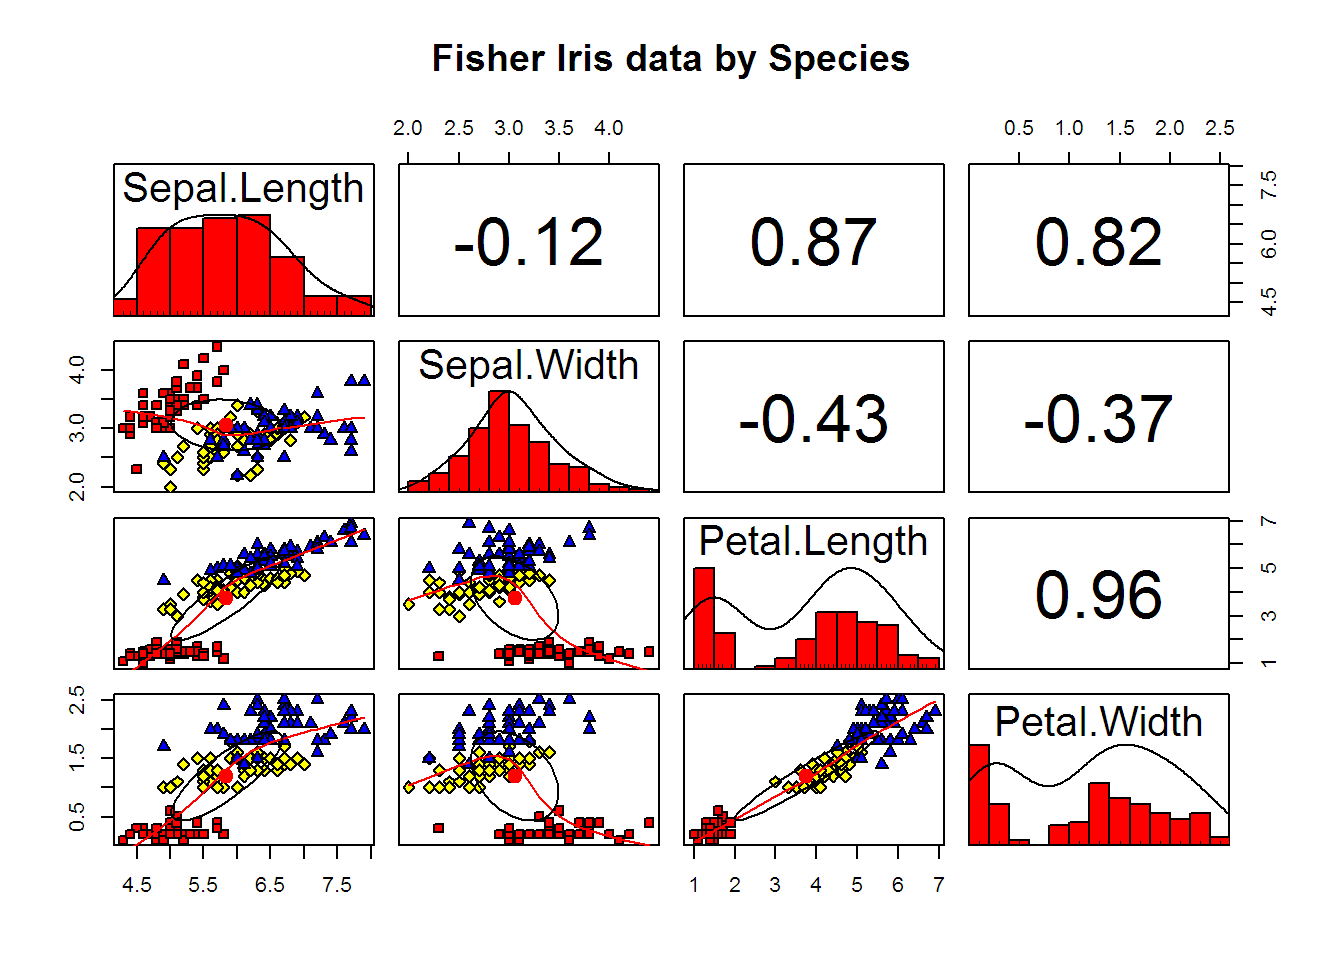
   #to show changing the diagonal

#to show 'significance'
   pairs.panels(iris[1:4],bg=c("red","yellow","blue")[iris$Species],
pch=21+as.numeric(iris$Species),main="Fisher Iris data by Species",hist.col="red",stars=TRUE) 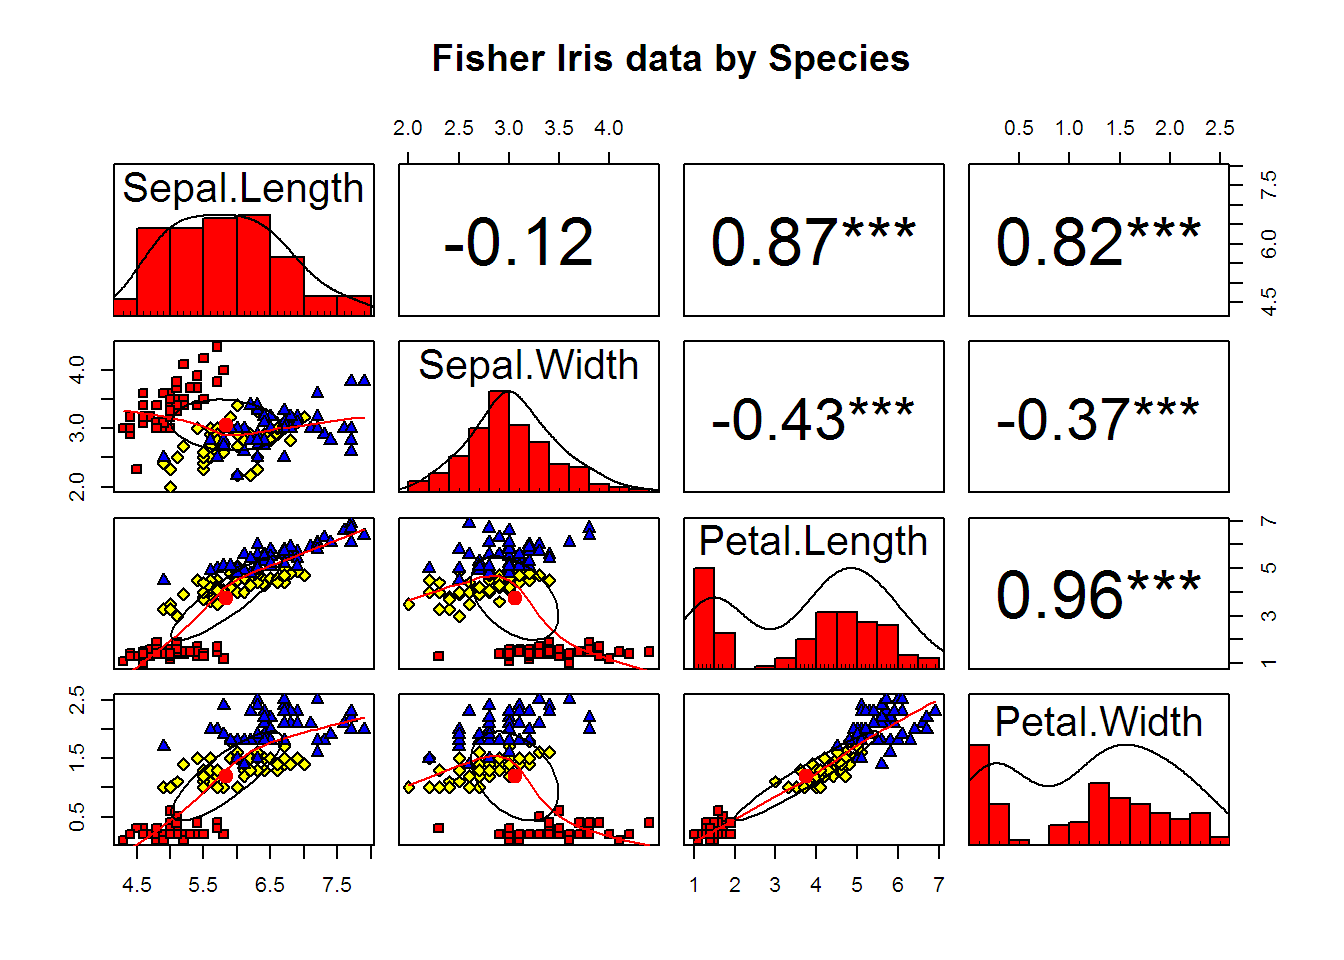
#demonstrate not showing the data points
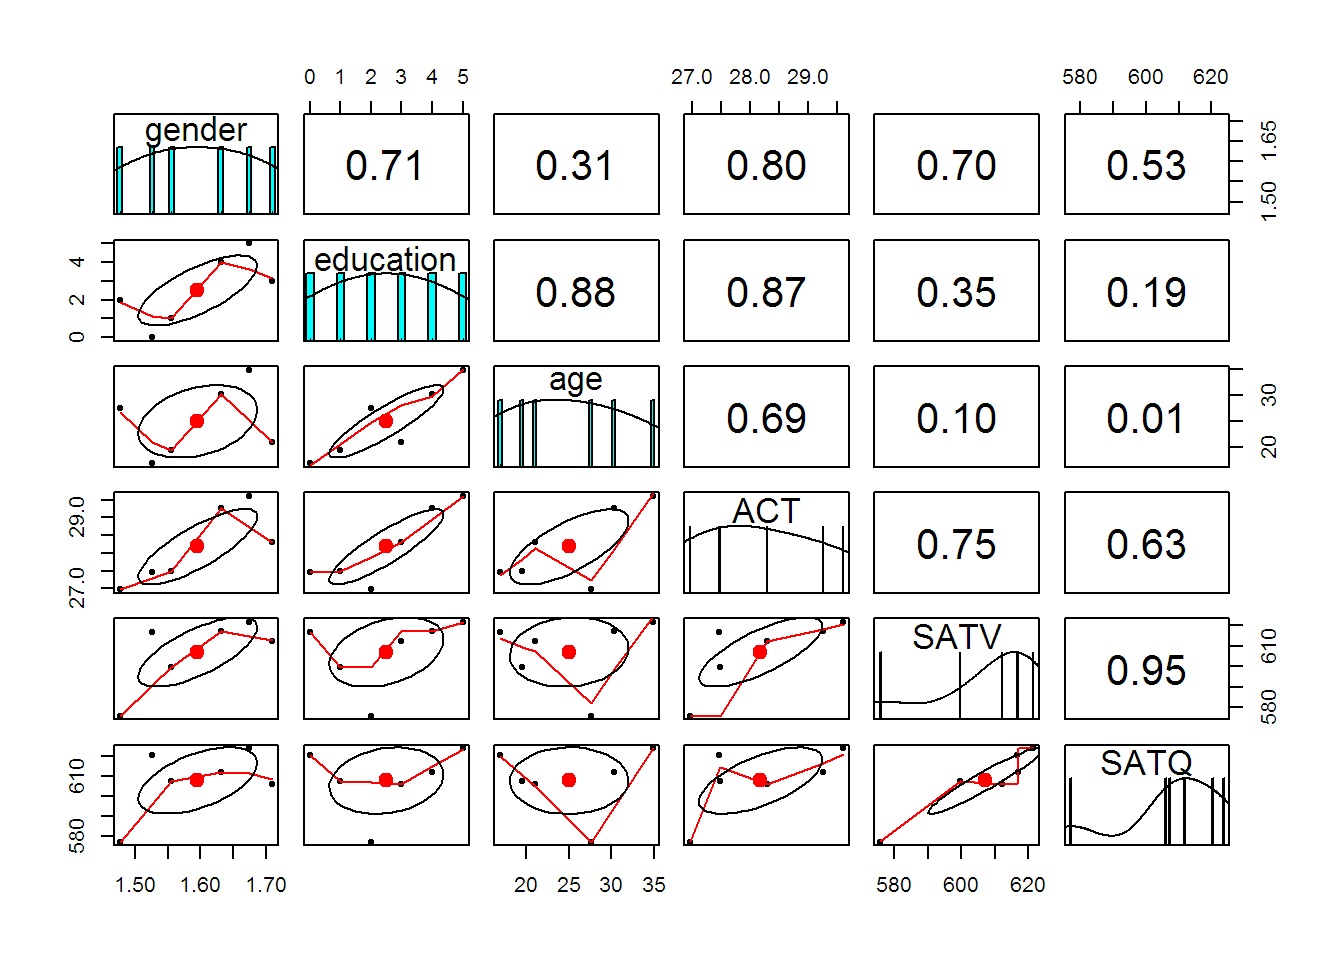
data(sat.act)
pairs.panels(sat.act,show.points=FALSE)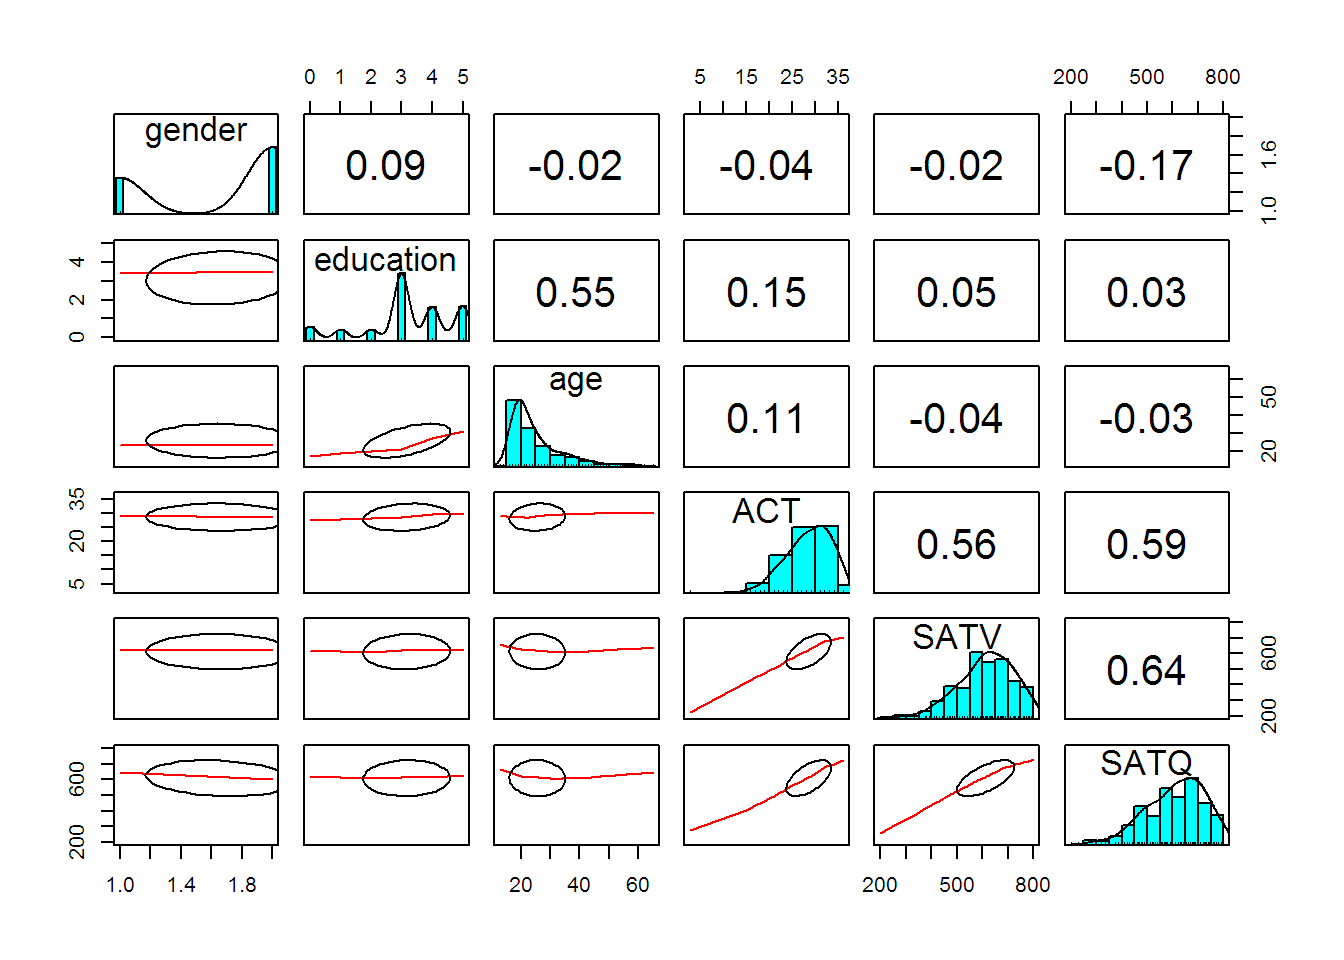
#better yet is to show the points as a period
pairs.panels(sat.act,pch=".")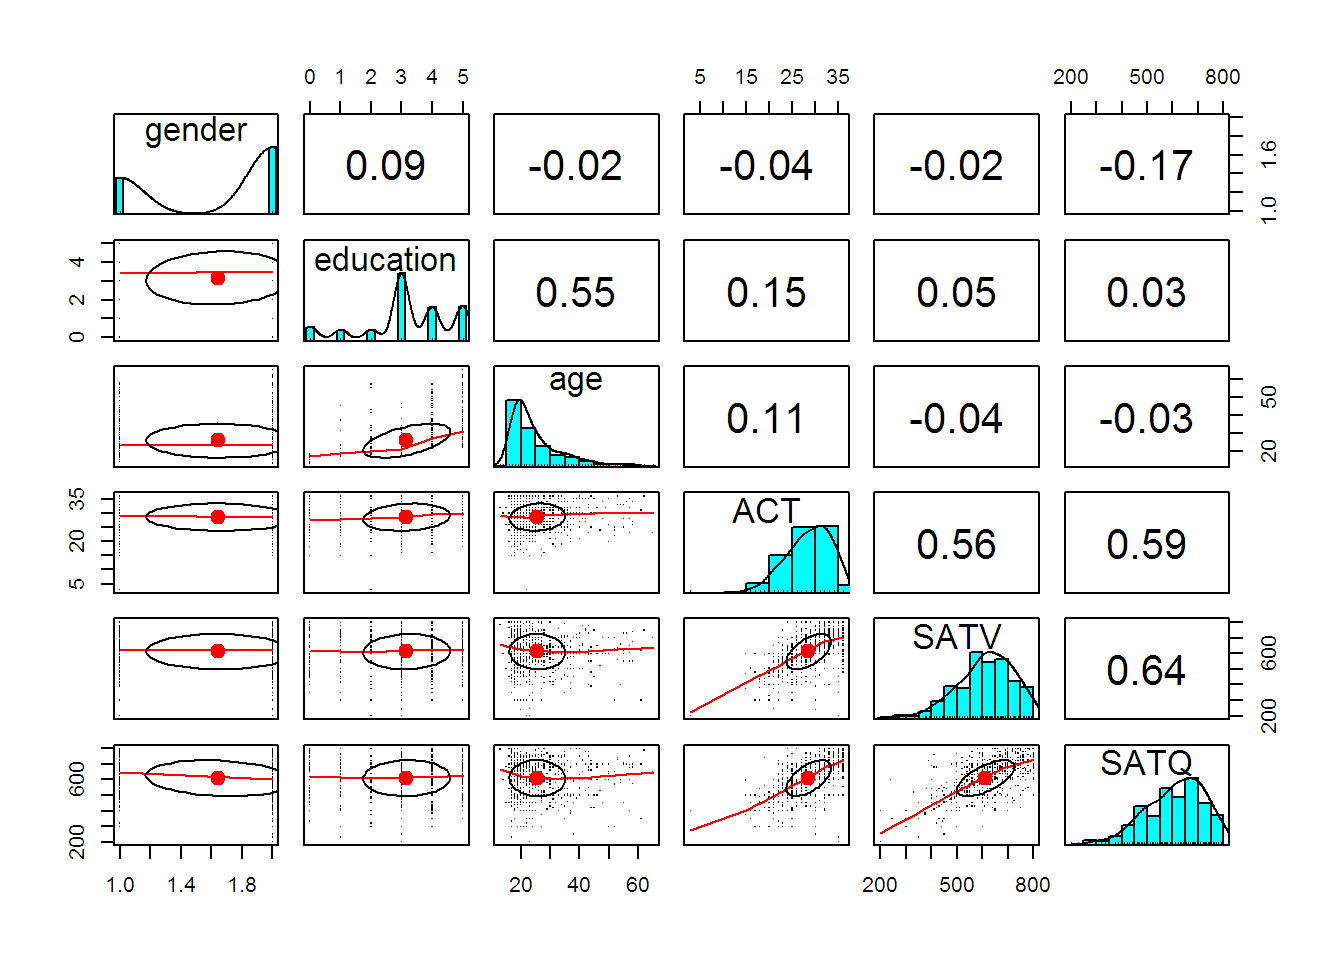
#show many variables with 0 gap between scatterplots
# data(bfi)
# pairs.panels(bfi,show.points=FALSE,gap=0)

#plot raw data points and then the weighted correlations.
#output from statsBy
sb <- statsBy(sat.act,"education")
pairs.panels(sb$mean,wt=sb$n)  #report the weighted correlations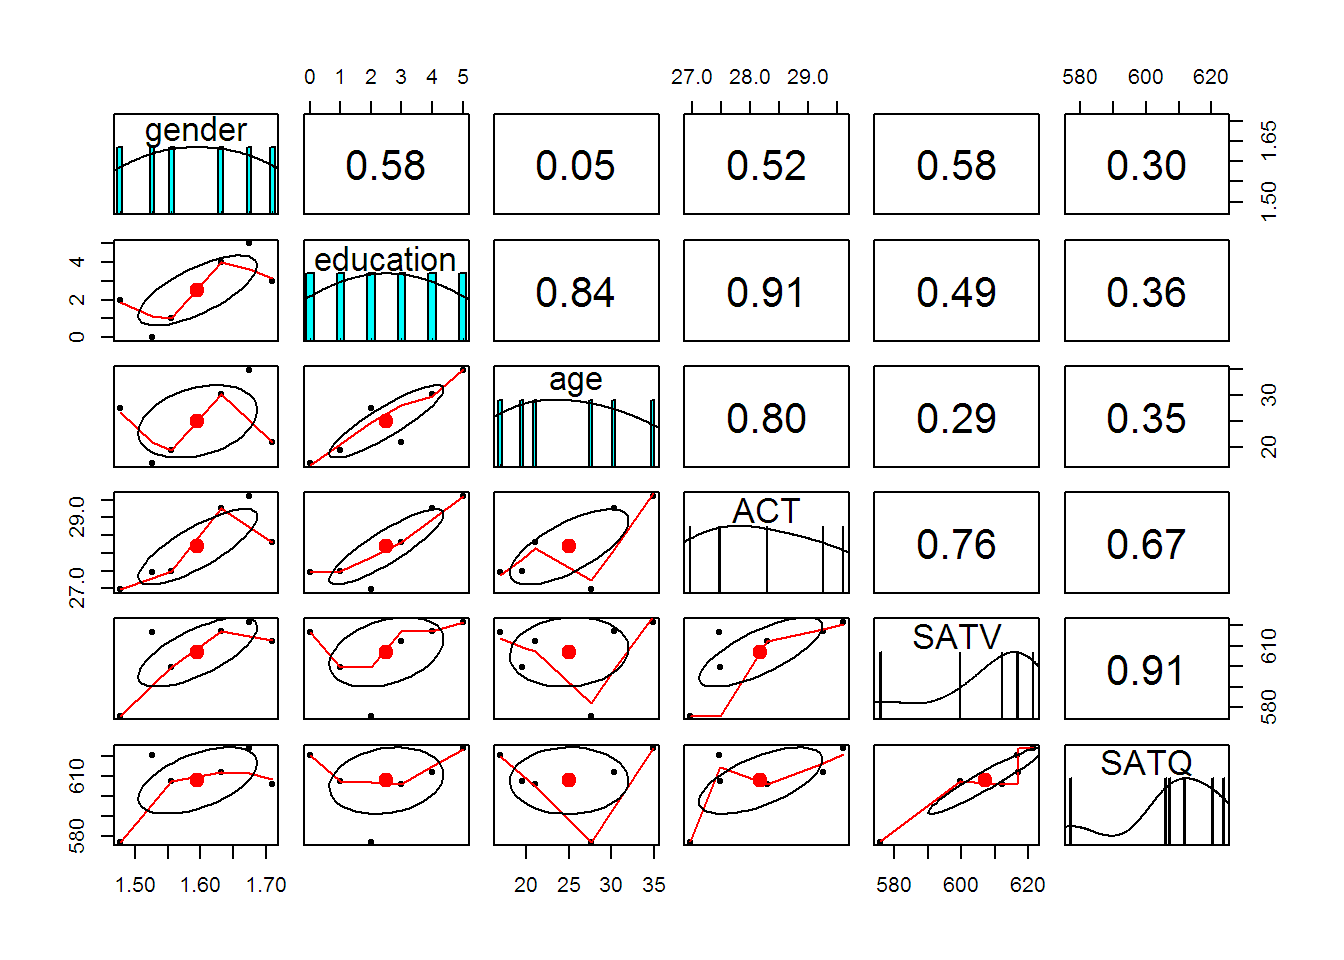
#compare with
pairs.panels(sb$mean) #unweighed correlations